Newsroom
RF Power Amplifier Performance Testing: Core Methods and Key Metrics Explained
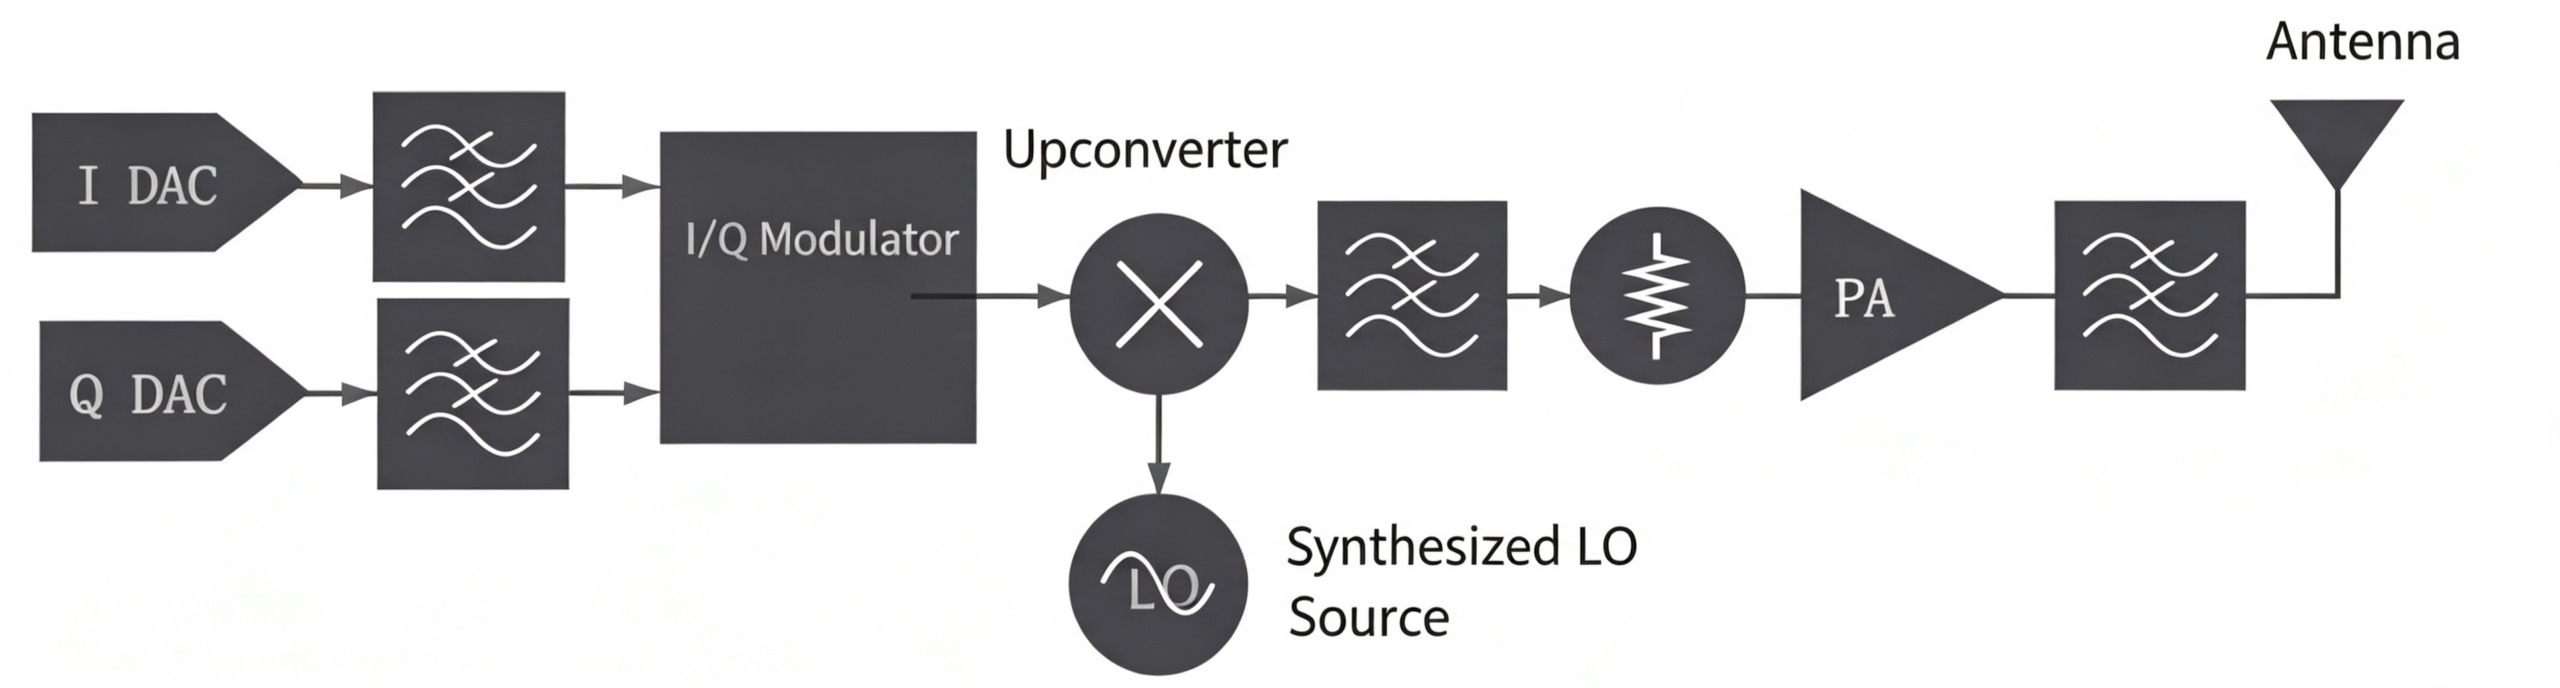
The RF power amplifier (PA) is the core building block of transmitter circuits. For broadband systems using non-constant envelope modulation like QAM and OFDM, the performance of the PA is particularly vital.
The power amplifier’s performance directly governs critical transmitter metrics. These include linearity and efficiency for systems with non-constant envelope modulation. It also affects equipment operating duration, which depends on efficiency and thermal dissipation.
Overview of RF Power Amplifier Testing Methods
Debugging and testing an amplifier usually involves the following key aspects:
Matching: Using a vector network analyzer (VNA) for input/output impedance matching adjustments.
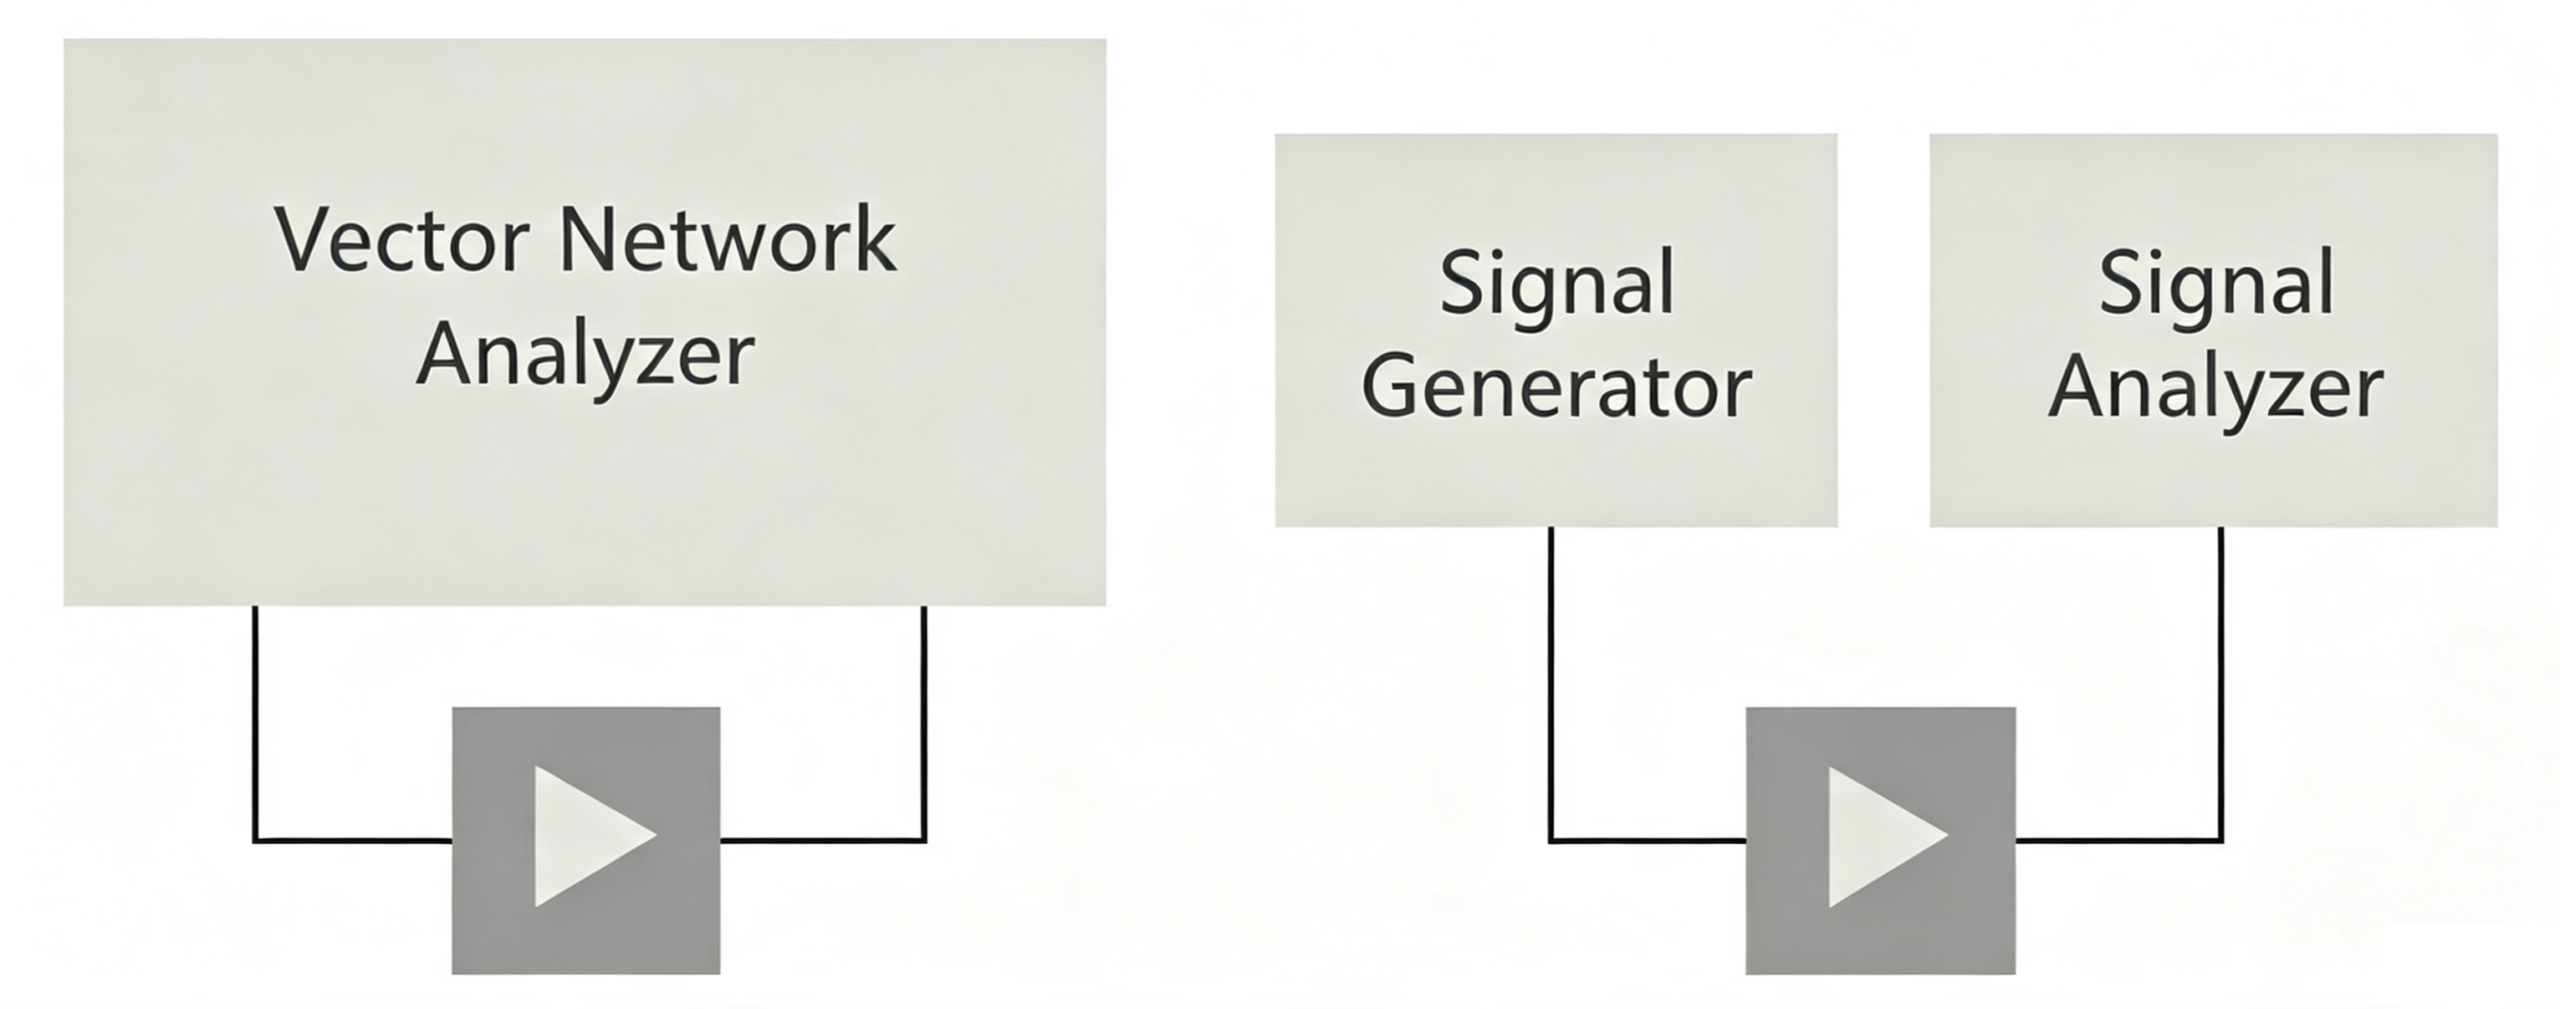
Gain, Power, and Efficiency: Test using a VNA (small-signal gain, S-parameters) and a signal source with a power meter/spectrum analyzer (large-signal gain, power, efficiency).
Linearity: Test it using a signal source and a spectrum analyzer or a vector signal analyzer (VSA), like intermodulation distortion (IMD), adjacent channel power ratio (ACPR), or error vector magnitude (EVM).
Harmonics: Tested using a spectrum analyzer.
Why Do We Need Multiple Sets of Instruments
Vector Network Analyzer (VNA):
- Good at: frequency sweeps (S-parameters), power sweeps (gain compression points, AM-AM), impedance matching tuning (Smith chart), load pull/source pull, and AM-PM testing.
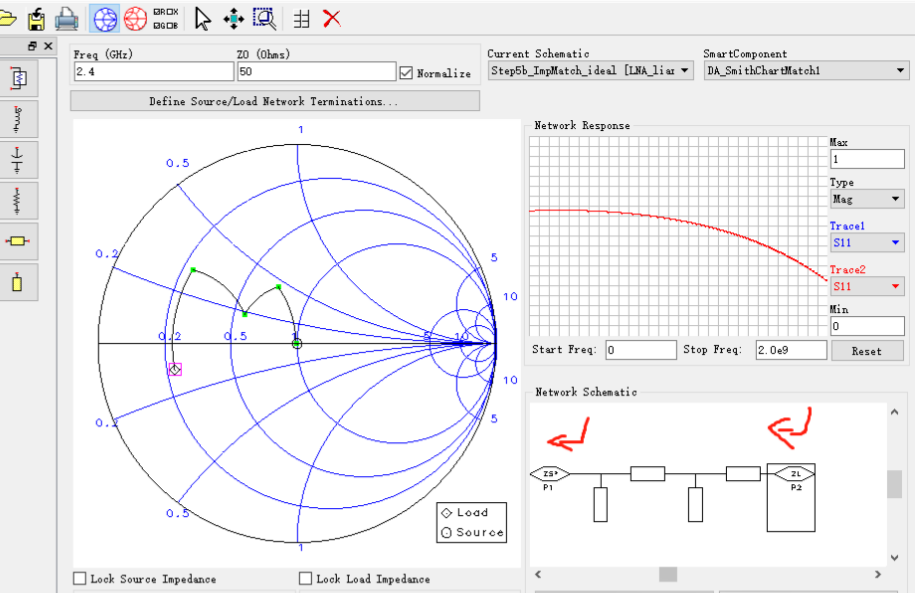
- Limitation: Doing linear tests on multi-tone signals (IMD) or complex modulated signals (ACPR, EVM) isn’t as straightforward or intuitive as using a spectrum analyzer/VSA; you usually can’t provide the high-power drive that the DUT needs.
Signal Source Spectrum Analyzer / Vector Signal Analyzer:
- Good at: generating complex test signals (single-tone, dual-tone, modulated signals); accurately measuring spectral components (harmonics, IMD products), modulation quality (EVM), adjacent channel power (ACPR/ACLR); carrying out DPD verification.
- Limitation: Directly doing impedance matching tuning and detailed frequency or power sweeps isn’t as efficient as using a VNA.
Conclusion: VNA and signal generator spectrum analyzer/VSA functions complement each other. Complete power amplifier characterization generally requires two or more test instrument configurations. Continuous tuning is needed throughout measurements. This process helps achieve the best balance of power, linearity and efficiency.
Key Data and Metrics for RF Power Amplifier Testing
Match
Purpose: To ensure maximum power transmission of the signal, reduce reflection loss, and optimize the power output capability, efficiency, and stability of the amplifier.
Principle: A power amplifier is a high-power active device, and its optimal load impedance is usually far from 50Ω. You need to use an impedance matching network to convert the amplifier’s input/output impedance to the system’s standard impedance (usually 50 ohms).
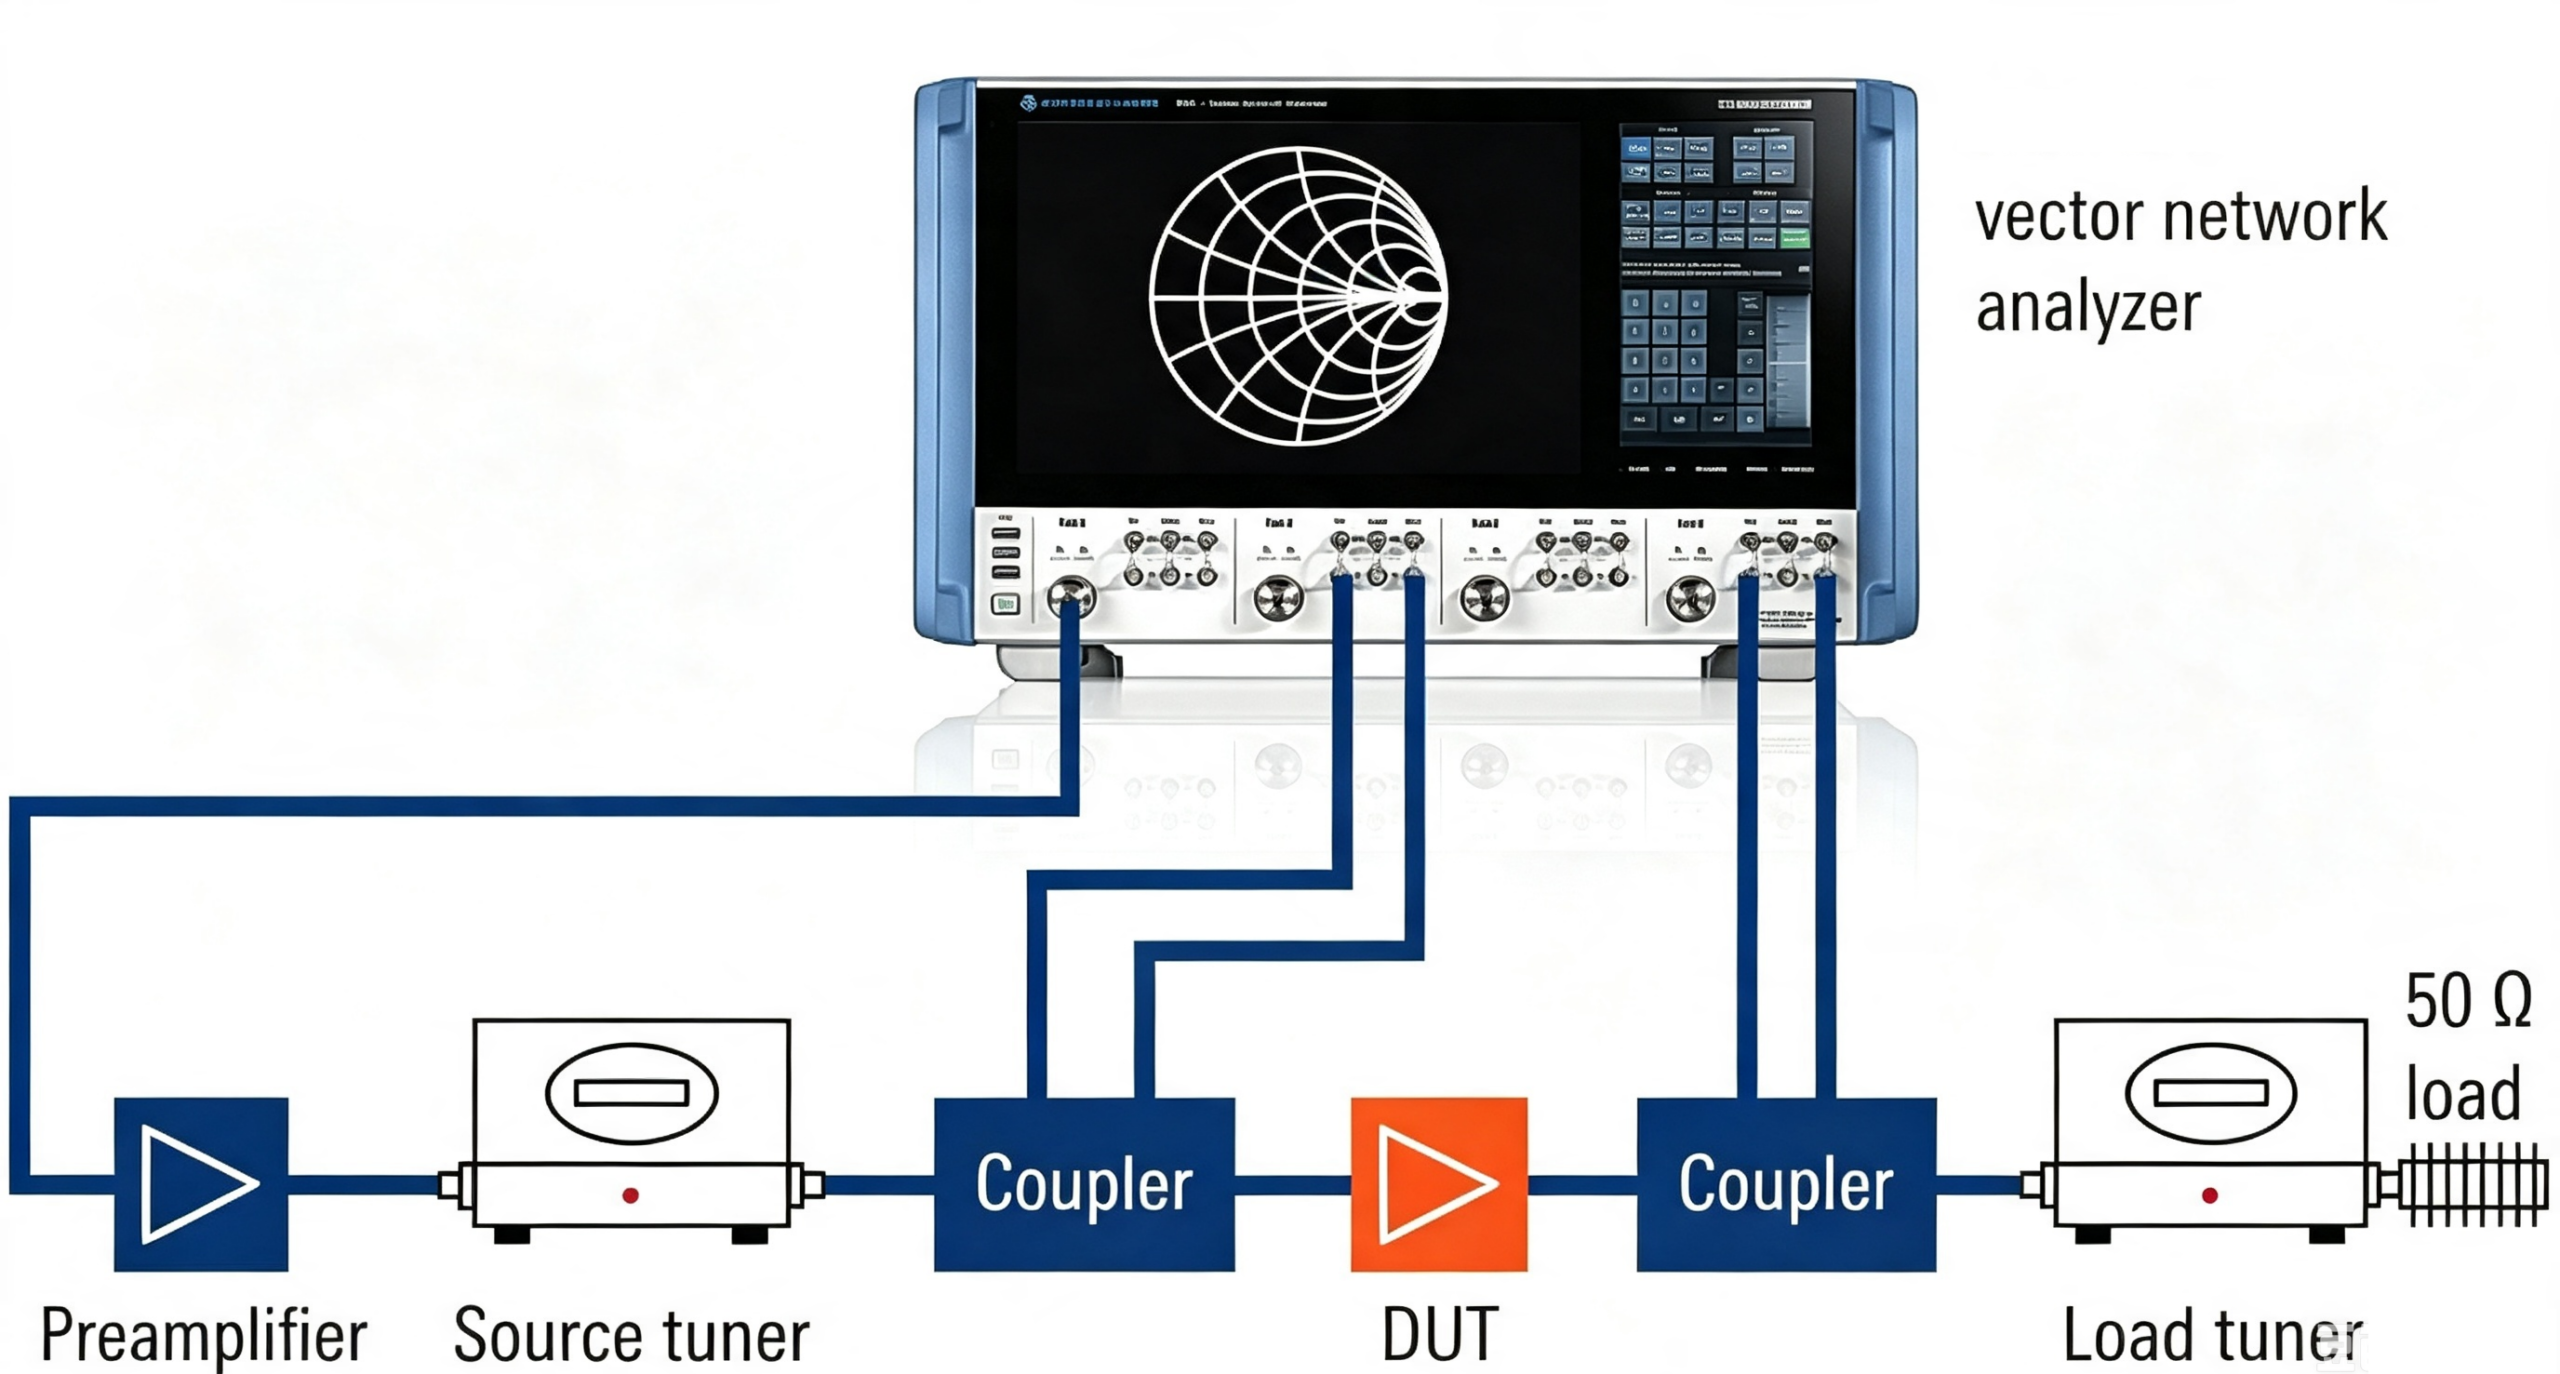
Key test:
S-parameter measurement (VNA): Measuring input/output reflection (S11, S22) and transmission (S21, S12) characteristics under small signals.
Load Pull / Source Pull (VNA Tuners): Measure the output power, efficiency, linearity, and other performance of a power amplifier under large signal conditions with different load/source impedances, and find the optimal matching point.
Frequency Response and Power Scan
Purpose: To determine the effective operating frequency range (bandwidth) of the amplifier and its output characteristics (gain, output power, efficiency, linearity) at different frequencies and input power levels.
Principle: A VNA can accurately control the frequency and power of the input signal and measure the output response.
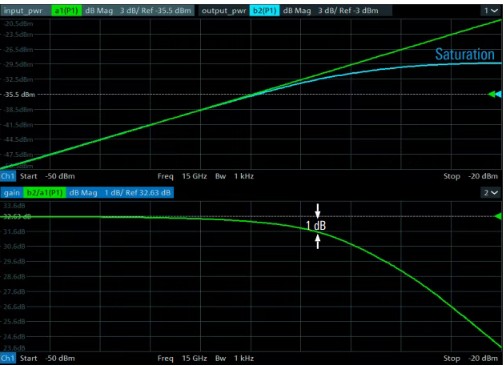
Key indicators:
Gain: S21 (small signal) or ΔPout/ΔPin (large signal).
Gain Flatness: The maximum variation in gain within the operating frequency band.
1dB Compression Point Output Power (P1dB): The output power when the gain drops by 1dB compared to the small-signal gain. It’s an important metric that shows the upper limit of linear output for large signals.
Saturated output power (Psat): The output power when you keep increasing the input power but the output barely increases anymore (gain is close to 0dB). It represents the maximum power output capacity.
Linearity
- Purpose of linearity: To assess the level of distortion in power amplifiers, which is crucial for communication systems (it affects signal quality and causes adjacent channel interference). The ‘memory effect’ of broadband amplifiers can significantly impact the linearization performance of DPD (digital predistortion).
- Principle: Nonlinearity in amplifiers introduces new spectral components (harmonics, intermodulation products, spectral regrowth) and signal waveform distortion.
Key metrics and testing methods:
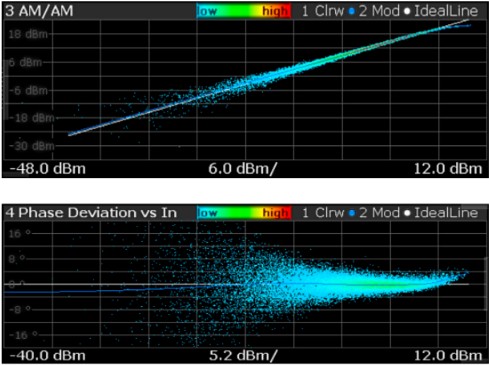
AM-PM Distortion:
- Definition: The phenomenon where changes in input signal amplitude cause phase shifts in the output signal.
- Importance: An accurate AM-PM model is crucial for effective DPD, especially when affected by memory effects.
- Testing: Usually done with a VNA by performing a power sweep to measure the output signal’s phase shift at different input powers (relative to the small-signal reference phase).
Intermodulation Distortion (IMD):
Definition: When two or more frequency signals are input into a nonlinear system, new frequency components appear at the output (combinations of the sums, differences, and multiples of the input frequencies).
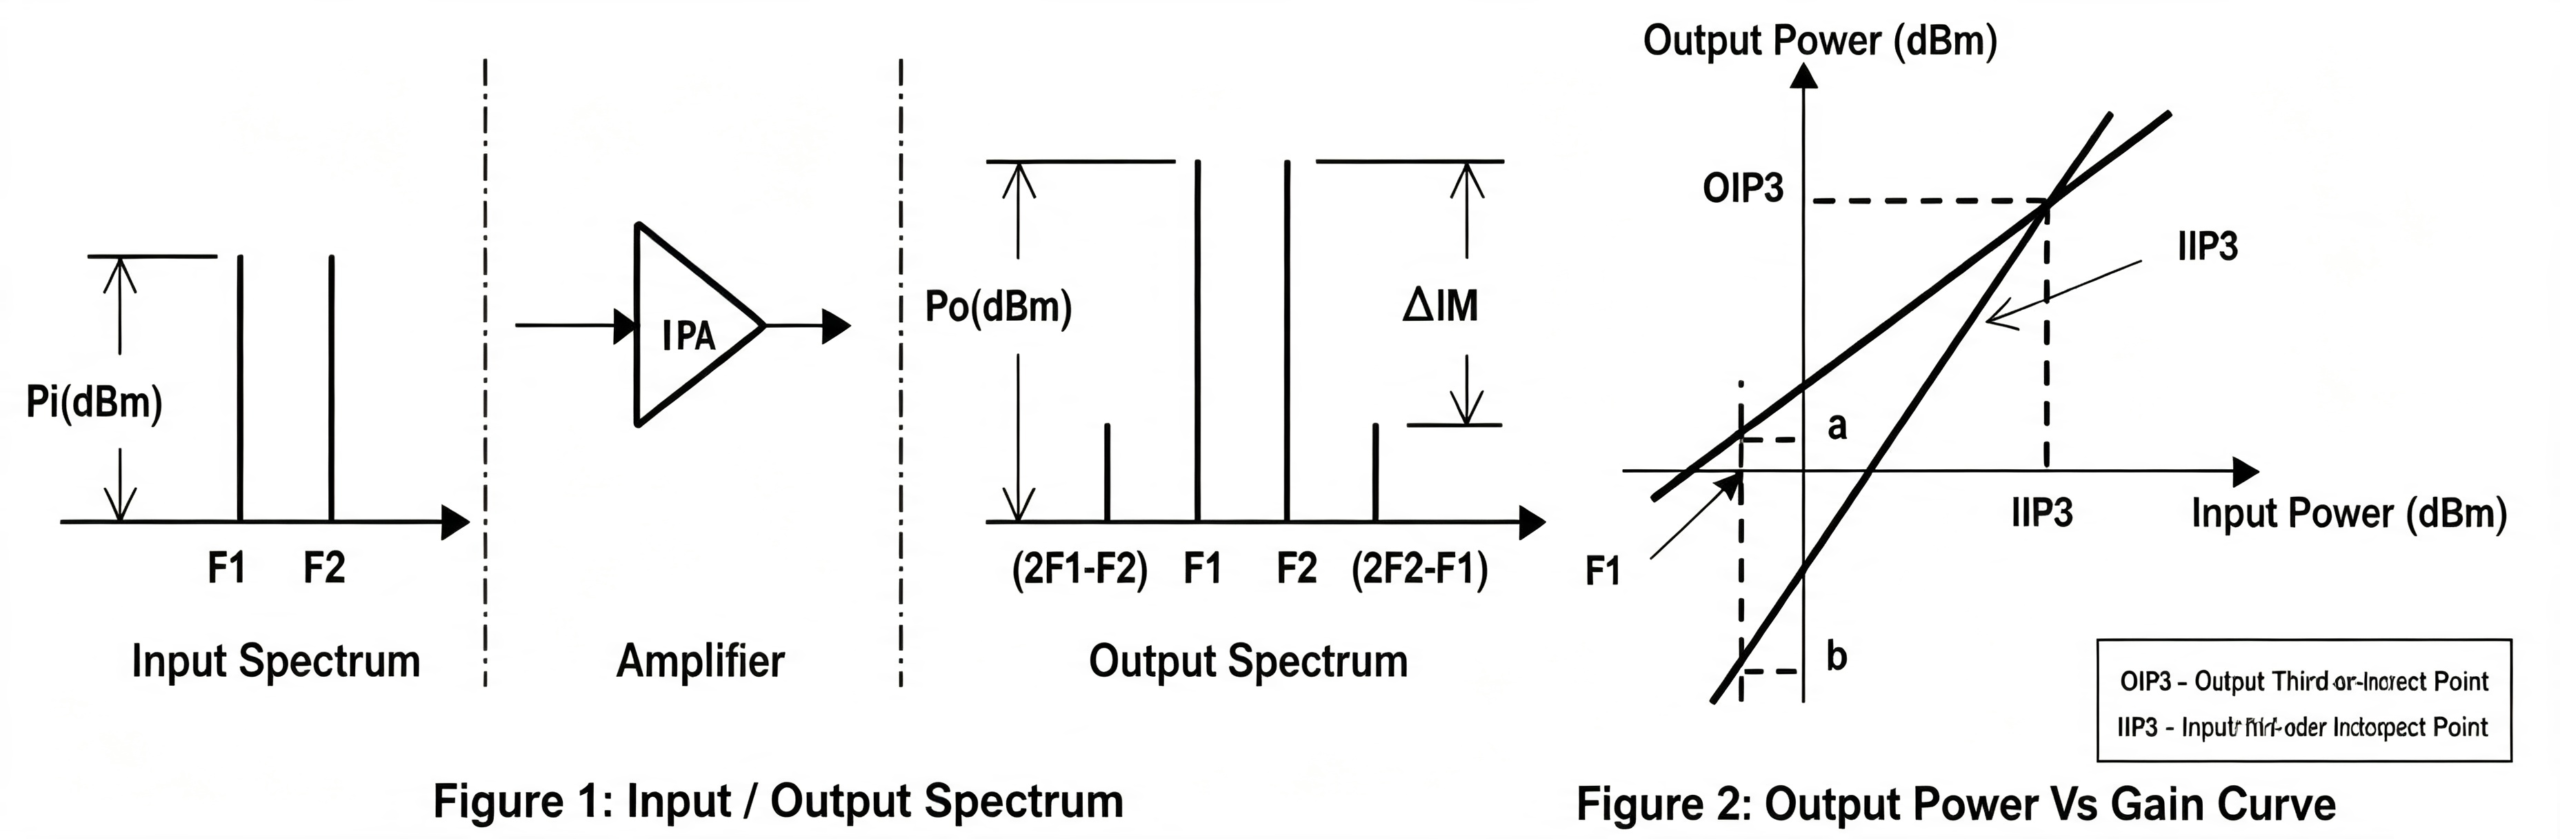
Most commonly used: Third-order intermodulation distortion (IM3), with frequencies at 2f1-f2 and 2f2-f1.
Key indicators:
IM3 Level: The absolute power (dBm) of the IM3 products at the specified two-tone input power.
Third-order intercept point (IP3):
Input third-order intercept point (IIP3): Theoretical input power point where the fundamental output power equals the third-order intermodulation output power (extrapolated).
Output third-order intercept point (OIP3): Theoretical output power point where the fundamental output power equals the third-order intermodulation output power (extrapolated).
Relationships: IM3 (dBm) = 3 * Pin (dBm) – 2 * IIP3 (dBm) G (dB) = 3 * Pout (dBm) – 2 * OIP3 (dBm) (because OIP3 (dBm) = IIP3 (dBm) + G (dB)) = 3 * Pout (dBm) – 2 * (IIP3 (dBm) + G (dB))
Test: Use a signal source (to generate a dual-tone signal) and a spectrum analyzer to measure.
Note: IMD performance closely depends on the amplifier’s operating point, namely the power back-off level. That said, the IMD changes may not be obvious within some working regions.
Error Vector Magnitude (EVM):
Definition: It’s a statistic that measures the error vector (both amplitude and phase) between the actually received symbol points and the ideal ones (usually shown as RMS), and it’s a key indicator of modulation quality.
EVM (%) = 100 * sqrt( (1/N) * Σ(|Error_Vector|^2) ) / |Reference_Vector| (RMS EVM)
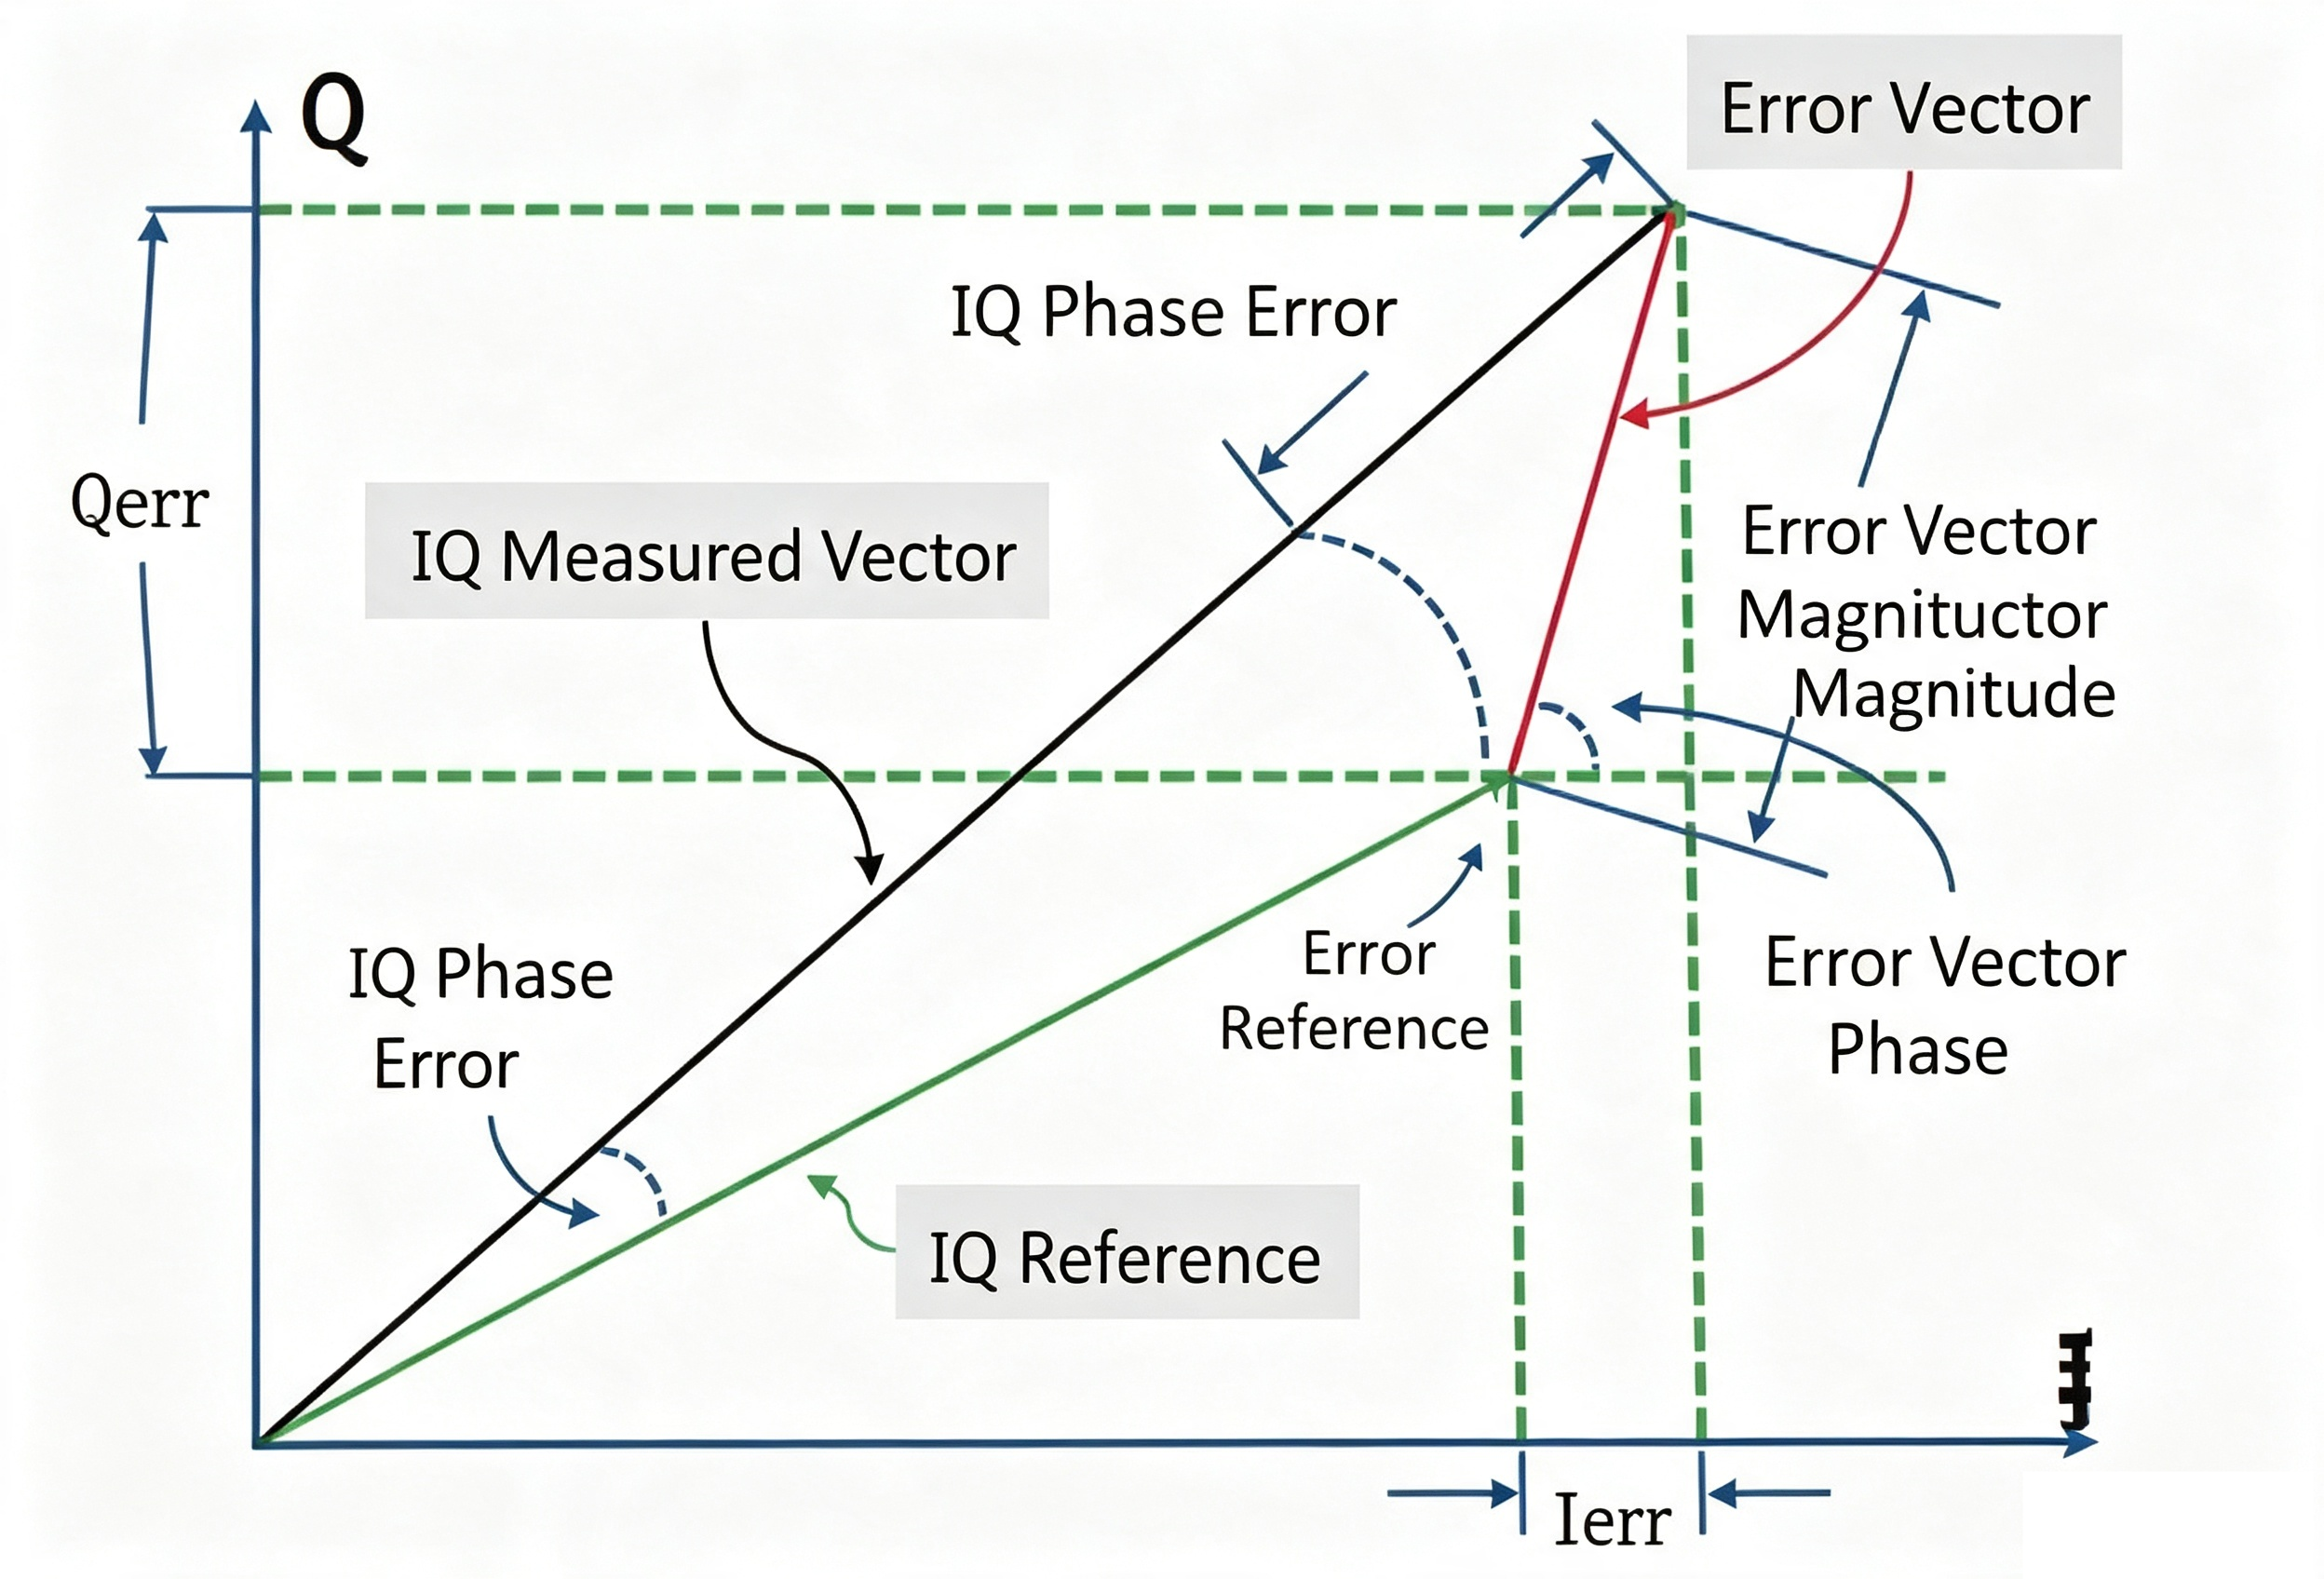
Importance: It most directly reflects the level of distortion a real communication signal experiences after going through a power amplifier, and it’s one of the key metrics system engineers care about.
Testing: Use a signal source (to generate modulated signals) and a vector signal analyzer (VSA) to measure it.
Adjacent Channel Power Ratio (ACPR) / Adjacent Channel Leakage Ratio (ACLR):
Definition: The ratio of the signal power in a specified channel (main channel) to the signal power that leaks into an adjacent specified channel (adjacent channel), measured in dBc. ACPR usually refers to analog adjacent channels, while ACLR refers to adjacent channels as defined by digital system standards (like LTE/5G).
Importance: It measures how much interference the spectral regeneration caused by power amplifier nonlinearity can cause to adjacent channels, and it’s an indicator required by communication standards.
Test: A signal source generates modulated signals. We perform measurements with a spectrum analyzer. Be sure to set suitable RBW and video bandwidth parameters.
Peak-to-Average Power Ratio (PAPR) and Clipping:
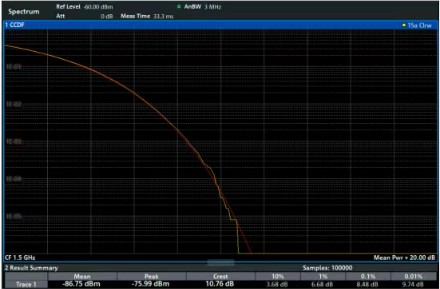
Importance: It’s really important to know the signal’s peak-to-average ratio before testing, as it determines the peak power the amplifier needs to handle.
Crest Factor Reduction – CFR:
Baseband Clipping: Done during digital baseband processing to reduce signal PAPR and ease the load on the power amplifier. If designed well, the distortion introduced is manageable.
Power Amplifier Hard Clipping: Nonlinear clipping caused by amplifier saturation, which can lead to serious spectral regrowth and in-band distortion.
Key Difference: PA hard clipping creates new nonlinear distortion components, while baseband clipping (if done properly) mainly just compresses peaks within an acceptable distortion range.
Harmonic
Purpose: To evaluate the strength of harmonic components generated by amplifier nonlinearity, providing a basis for designing filters at the amplifier output.
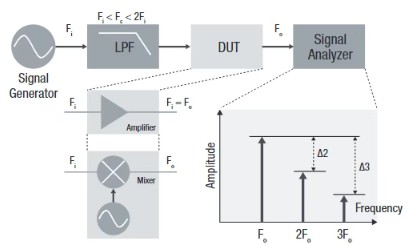
Principle: Nonlinear devices will convert the fundamental frequency energy into its integer multiples (2f0, 3f0, …)
Key Metrics:
Harmonic Suppression: The ratio of specified harmonic power (like 2nd or 3rd harmonics) to the fundamental power (dBc). Absolute harmonic power level (dBm).
Testing: Use a signal source (generating a single-tone signal) and a spectrum analyzer to measure.
Importance: Harmonics are the main source of out-of-band emissions and directly affect the design complexity and selection of filters in the power amplifier stage (suppression requirements).
Efficiency
Purpose: To evaluate the amplifier’s ability to convert DC power into useful RF output power. This is directly related to system power consumption, heat generation, and battery life (for mobile devices).
Key metric:
Power Added Efficiency (PAE): The most commonly used efficiency metric for amplifiers.
Definition: The ratio of the increase in RF output power to the DC input power consumed.
Test: Measure the amplifier’s input RF power (PRF_in) and output RF power (PRF_out) using a power meter or a spectrum analyzer (make sure the power measurement is calibrated).
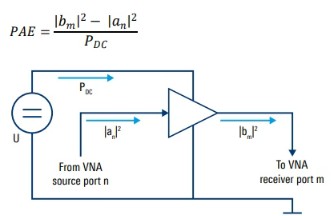
Use a voltmeter and ammeter (or the reading function of a DC power supply) to measure the DC voltage (VDC) and current (IDC) supplied to the amplifier, then calculate PDC_in.
Plug these into the formula above to calculate PAE or efficiency (η).
Trade-off: The linearity and efficiency of an amplifier usually conflict with each other. Boosting output power and efficiency often worsens linearity metrics (like IMD, ACPR, EVM). One of the core design challenges is to maximize efficiency while still meeting the system’s linearity requirements.
Conclusion
RF Power amplifier testing is a comprehensive, multi-dimensional process. It requires using various instruments (VNA, signal source, spectrum analyzer, VSA, power meter, volt/current meter) to characterize and optimize a range of key indicators like matching, gain, power capability, linearity (AM-PM, IMD, EVM, ACPR), harmonics, and efficiency. …
For RF power amplifier components and professional technical consultation for your test systems, contact ZR Hi-tech. We deliver high-performance RF devices to meet communication, radar and wireless testing requirements.